As Costs Rise, Learn to Index Energy Productivity

The cost of natural gas is surging, and since so much of our electricity is generated using gas-fired turbines, those costs soon may increase too. A variety of actions can be implemented to improve efficiency, but how can you determine if these efforts are successful? It might be helpful to know how much energy is needed to produce a pound of cast metal. We chose pounds of production because that was being recorded daily at the melt deck of a client, for each operator.
Electric Productivity Index. Two pieces of data are required to compute our Electric Productivity Index value. The first comes directly from your electric bill: total kilowatt hours (kWh.) The second is pounds produced per day. You compute the Electric Productivity Index value by dividing the total pounds produced by the total kWh. The following example is on a monthly basis.
Total Pounds Produced / Total kWh = Electric Productivity Index
A higher Electric Productivity Index equals Improved Efficiency (and probably lower electric costs.) So, now you can now track the relative efficiency of the electricity used by an entire facility to produce a pound of output.
This could be adequate to track electric expense patterns for one or more facilities, but you may also want more detailed data to research and monitor efficiency-improvement activities.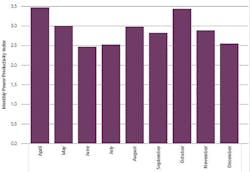
Management teams at individual foundries are sometimes given an energy savings goal by senior management. How they achieve the savings goal is a decision for each foundry to make. Determining Electric Productivity Index values for work centers and power-hungry equipment can help them reach their goals.
“If you can't measure it, you can't manage it.” This adage among foundrymen is especially appropriate for understanding the origins of a foundry’s utility charges. The good news is that many foundries have installed equipment that monitors electric usage in work centers, melting furnaces, and other large equipment, often for maintenance-related requirements. Such data also may be useful for analyzing electricity-consumption patterns.
Also, specialized sensors can be installed to collect consumption data. The price of such sensors are becoming very reasonable.
More data enables better understanding of usage patterns. While working with one foundry, we installed power monitoring equipment on five furnaces. Daily production logs were maintained by the operators. In addition, we built a table representing power levels used by the furnaces during melting operations. Using the data gathered by the power monitoring sensors and the daily production logs, we were able to chart the monthly electric productivity index for each furnace during melting periods.
This allowed us to compare the relative Electric Productivity Index of each melting furnace over a number of months. Now, our client foundry is using this data to optimize furnace settings and shares this data with all furnace operators. Melting operations can be further refined as efficiency improvements are realized. Changes to settings can be realized quickly and corrected.
Gas Productivity Index. You may be interested in tracking how efficiently you are using natural gas, too. Similarly, two pieces of data are required to compute the Gas Productivity Index value. The first comes directly from the natural gas bill; total therms used. The second is pounds produced per day. Compute the Electric Productivity Index value by dividing the total pounds produced by the total therms consumed. (You may have something more appropriate to use than pounds per day. This example reflected the interest of our client.)
More detail, better analysis. The greater the detail, the better will be the analysis and potential insight. These sensors we installed to record the power consumption of each of the furnaces, captured electric usage every two seconds. At that level we could see every power adjustment made by the operators. However, this volume of data presented some challenges; every month 43,200 data records would be created for each furnace; 216,000 data records for all five furnaces. Millions of records each year! How would we handle such data volumes?
We became early adopters of Microsoft’s Power Business Intelligence (PowerBI) product. Designed to handle many millions of rows of data, it proved to be an excellent tool to process, analyze, and report on the vast amounts of data from multiple sources.
A critical factor in the data recording process is that the date and time of recording from the sensors is synchronized so that data from the sensors can be compared. A single “version of the truth” is then available and resulting analysis is applicable between machines, departments and facilities.
Energy Productivity Indices allow for an apples-to-apples comparison of the basic data reflecting foundry operations. It can give insight to overall operations as well as energy-intensive activities. The level of detail is entirely dependent on the data available. However, a high level perspective can easily be derived from your electric bill and production reports.
Brian Reinke, president of TDI Consulting, is an energy-cost saving consultant. Contact him at [email protected]
About the Author
Brian Reinke
President
Brian Reinke, president of TDI Energy Solutions, is an energy-cost saving consultant. Contact him at 630-343-0971.