


U.S. demand for refractory products is projected to rise 3.3% annually to $2.6 billion in 2016. Notably, the rise in demand will be driven largely by increases in domestic steel production volumes, after a several years of decline. The information is drawn from a new report on the refractories market offered by The Freedonia Group Inc., an industrial market research firm. The 242-page study is available for sale.
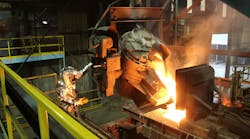
In 2011, sales of refractories to iron and steelmakers totaled $990 million, representing 45% of all refractory sales. After declines in domestic steel production that started with the 2008 global recession, U.S. steel manufacturing and associated refractory demand is forecast now to rise through 2016.
Also prompting increases in refractories demand will be a strong rebound in nonresidential spending through 2016, Freedonia reports, which will prompt increases in production of ceramics products and glass. Output from such industries will rebound as the U.S. economy continues to grow, fueling related refractory demand.
Nonmanufacturing markets will spur demand growth, too, including waste-to-energy plants, traditional power plants, and commercial ovens, though Freedonia notes these markets are all somewhat small.
The largest increases in refractories sales - more than 50,000 tons through 2016 - will be in the engineering contractors market, which also endured declines during the 2006-2011 period.
Importantly, the researchers note that a shift in consumption toward higher-priced, advanced products will boost the value of refractories sales, but future demand will be restrained by the development of longer lasting, more durable refractories. “Most materials manufacturing industries have reduced their per-production-unit consumption of refractories by using newer, more durable products and improved processes,” according to Freedonia.
|
U.S. Refractory Demand (Millions of dollars) |
|||||
|
|
2006 |
2011 |
2016 |
% Annual Growth |
|
|
2006-2011 |
2011-2016 |
||||
|
Refractory Demand |
2,236 |
2,230 |
2,625 |
-0.1 |
3.3 |
|
Bricks and Shapes |
1,286 |
1,300 |
1,520 |
0.2 |
3.2 |
|
Monolithics |
590 |
507 |
596 |
-3.0 |
3.3 |
|
Other Forms |
360 |
423 |
509 |
3.3 |
3.8 |
|
The Freedonia Group Inc., copyright 2012 |
|||||
In cash terms, the fastest growing markets for refractories will be among producers of nonmetallic minerals, including ceramics, glass, and cement.
In terms of value, market gains for refractories will be led by monolithic refractories and specialized shapes. The performance of monolithic refractories has improved significantly, Freedonia noted, and technology advances have made specialty shapes more cost effective and efficient. Demand is seen increasing for each of those product classes.
Buyers increasingly are choosing more expensive high-grade refractories, including products formulated for specific operating conditions. This will result in demand for non-clay refractories in tons outpacing demand for clay-based products, based on performance.
However, Freedonia predicts that sales of clay refractories will shift toward higher grades, which means that demand for clay-based products (in dollar terms) will rise at a faster pace than sales of non-clay refractories.
Refractories, is a 242-page study available for $4,900.00 from The Freedonia Group Inc. Visitt www.freedoniagroup.com, or contact [email protected].